We have map records since the 17th Century regarding the land use in Greenwich Peninsula. These maps provide us with a good visual understanding about the changing state of the Peninsula.
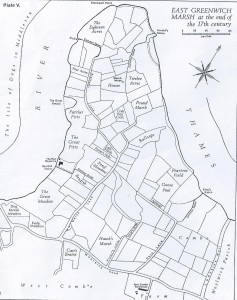
17th Century Land Boundaries Map
Here you can see a map that details the land boundaries and roads on the Peninsula in the 17th Century, it was constructed from a collation of information sources. It shows us that the majority of the land still existed as wetland, with tidal marshes and sparsely dotted farmland plots. At this point in time there would have been little or no water management to drain the land or prevent it from flooding, so only a small amount of development had occurred here
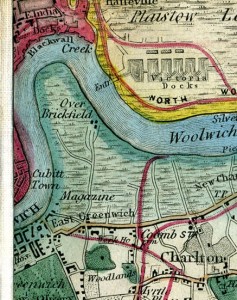
Cary’s 1818 Map
This map here shows the entire of the peninsula to be barren of development, which we know is not accurate, as much of the land was owned and some parts even farmed in the 17th Century. The lack of detail on this map is indicative of the small population. It is generally found from other maps made in this period that areas that were densely populated are far better recorded.

Greenwood’s Map of London 1827
This map, produced in 1827, shows a similar picture of the Peninsula: lacking buildings and still pretty much an agricultural area, with a road and some field divisions. The interesting aspect of this map is that the cartographer has made an effort to mark out the tidal marshland around the Peninsula, and the small wooded area on the east side of the Peninsula. This area would have been rife with wetland wildlife and it is these habitats that the river terraces and Greenwich Peninsula Ecology Park are trying to emulate today.
James Wyld’s Map 1872
Like the map before, Wyld’s map lacks detail of the land use on the Peninsula, but it does document the tidal marshlands that surround the Peninsula. We are aware from written records that industry had arrived in the Peninsula by this time. Industries such as ship building and telegraph cable production had moved onto the peninsula alongside the farms, from this point it would not take long for the area to be taken over by industry and begin losing it’s agricultural character.
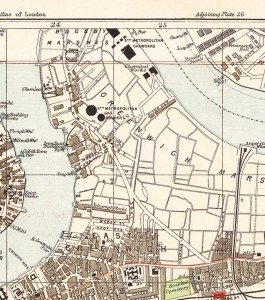
1902 Map
Just thirty years later, the whole landscape had changed, from being primarily agricultural to being completely dominated by industry. It is from this point in history that the maps of the Peninsula become more detailed and give us a stronger sense of the changing character of the area. Two of the most notable developments in this time were the opening of the Blackwall tunnel in 1897 and the movement of Metropolitan Gasworks onto the peninsula in the 1880s. These developments radically changed the Peninsula, and it went from a sleepy rural area to infamously crowed and polluted in a short space of time.
Below is a sketch of the area in 1920, showing how the gas works and industry looked on the Peninsula. You can see how the rural and wetland character was long gone by this point.

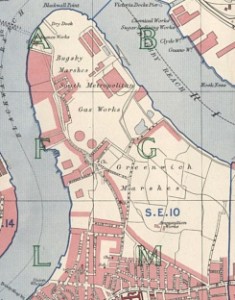
1940 Map
By the 1940s, Greenwich was firmly known as an industrial area. This had much to do with the mass movement of the larger industries onto the peninsula in the 1920s. This map represents Industrial Greenwich before World War 2. During WW2 the Peninsula suffered bomb damage and never really recovered from that loss of major industry. This Peninsula like much of London’s industries and docks went into a long decline during and after the postwar depression.


